ABC Analysis of Hospital Pharmacy
Introduction
Due to complex medicine, system
there is need to planning, designing, organizing, and maintaining the pharmacy
in such a manner that result in efficient management of the pharmacy, which
directly affect the better clinical care.
In medical logistic management two important
factor are
- Cost
- The criticality
of the item
So among the various selective inventory control technique most suitable for the hospital pharmacy are always better control (ABC) analysis and vital essential and desirable (VED) analysis or combination of ABC and VED analysis.
ABC analysis is method used to classifying items according to
annual value in monetary terms while VED analysis takes care of the criticality
factor of Drugs and consumables.
Under ABC
analysis medicine inventory are
classified into category
A (High usage value)
B (Moderate
usage value)
C (Low usage
value)
Under VED analysis medicine inventory are classified into category
Vital (critical
for life and patient care)
Essential (Critical
but alternative acceptable)
Desirable (Low
critical value)
How to do ABC analysis (Pharmacy) in excel in 8 easy steps?
Step 1 : Make
a list of total medicine and consumables see Fig.1
Step 3 : In
next column enter “ Yearly consumption” see Fig 3
Step4 : Multiply (unit cost* Yearly consumption) see Fig 4
Step 5 : select the whole table, go the Data
tab, and arrange the total value
column from largest to smallest
Step 6 : calculate
“Cumulative figure”
1 row= 1st
row
2nd row= 1st
row + 2nd row
3rd Row= 2nd row+ 3rd Row See fig 6 A & 6 B
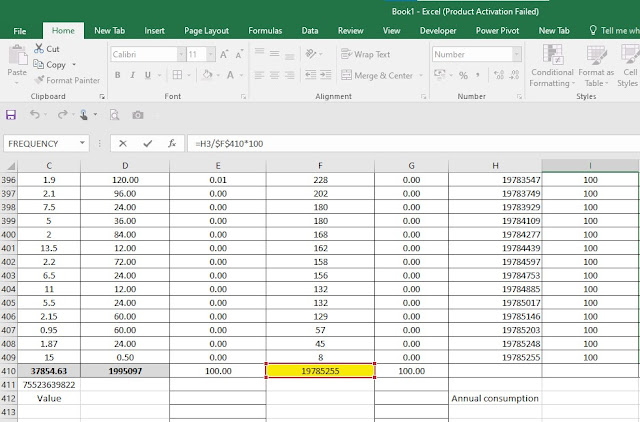
Step 7 : Calculate “Cumulative %”
Cumulative figure/sum total of total
value*100 see fig 7a
Note:
add $ sign for fixed sum total value “Cell” see fig. 7b
Step 8 : Categorization
into ABC
From cumulative % column drag upto 70% this is A category
enter in next column see fig 8 A
From cumulative % column drag from 71% to 90% this is B category enter in next column see fig 8 B
From cumulative % column drag from 91% to 100% this is B category enter in next column see fig 8 C


Post a Comment